

Diesel pricing indexes are the wholesale reference points that determine the per-gallon commodity cost in commercial rack-based and delivered-fuel contracts. Three benchmarks drive nearly every invoice you receive: NYMEX Ultra-Low Sulfur Diesel (ULSD) futures traded on CME Group set the national price signal; OPIS and S&P Global Platts publish daily terminal rack and spot prices that translate that signal into regional delivered rates; and the U.S. Energy Information Administration (EIA) and Department of Energy (DOE) weekly retail metrics track pump-level averages across PADD regions. Understanding how these three layers interact is the difference between auditing an invoice with confidence and absorbing cost increases you never agreed to.
Two buyer impacts stand out immediately:
- Index choice affects cash flow and invoice timing. A contract tied to a 30-day lookback window smooths volatility but delays price drops reaching your invoice; a daily rack reference moves faster in both directions.
- Regional index points can shift your billed price materially. West Coast premiums can run $0.30–$0.80 or more per gallon above national averages during constrained supply periods, making a national benchmark a poor proxy for a terminal in Los Angeles or Seattle.
Table of Contents
- How diesel pricing indexes actually work
- Which U.S. indexes should your procurement team track?
- Why index literacy directly affects your fuel budget
- How commercial contract pricing formulas are built
- How to negotiate index-based pricing with a fuel supplier
- Worked example: from index quote to billed per-gallon price
- When national indexes don’t reflect your market
- Key Takeaways
- Anytimefuelpros delivers transparent, terminal-anchored fuel pricing
- Useful sources and data feeds to bookmark
How diesel pricing indexes actually work
The pricing chain runs from futures exchange to terminal to your invoice in four distinct steps, and each step adds cost.
- NYMEX ULSD futures (CME Group) set the national commodity benchmark. These contracts trade in 42,000-gallon lots and settle daily, giving the market a forward-looking price signal for Ultra-Low Sulfur Diesel.
- Regional spot markets (reported by OPIS and S&P Global Platts) translate futures prices into location-specific values. A spot differential reflects the premium or discount at a given hub versus the NYMEX settlement.
- Terminal rack prices are published daily by price-reporting agencies. OPIS RackPro and equivalent Platts services post rack values by terminal and product; suppliers add their margin and delivery fees to these published numbers.
- Delivered billed rate is what appears on your invoice: terminal rack + distributor margin + logistics/delivery fee + applicable state and federal taxes.
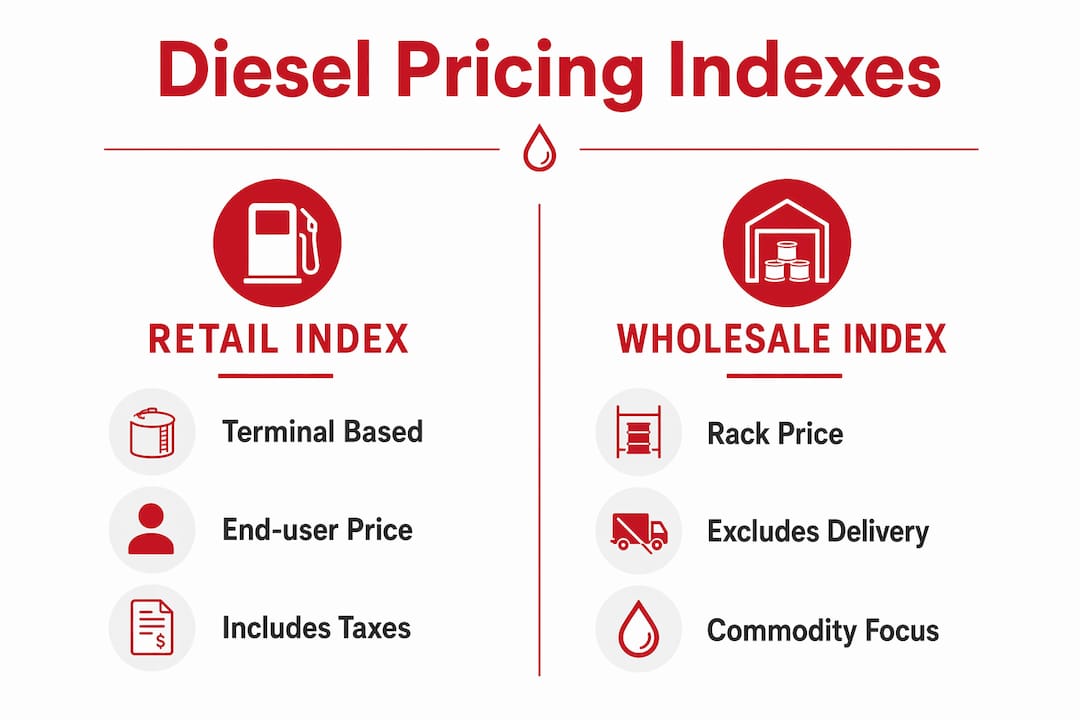
The DOE/EIA weekly retail metric is not a wholesale price. It surveys roughly 350 retail stations and captures pump-level overhead, taxes, and retailer margin. Using it to audit a wholesale invoice will almost always show a gap that looks like supplier overcharging — when the real issue is that you are comparing two different price layers. Wholesale buyers should anchor to NYMEX/OPIS/Platts terminal values, not the DOE retail figure.
The distinction matters because retail and wholesale indexes measure fundamentally different things. Retail reflects what a truck stop charges after covering real estate, staffing, and credit-card fees. Terminal rack reflects what a distributor pays to load product at a pipeline or refinery terminal.
Pro Tip: When you receive a new supplier proposal, ask them to identify the specific terminal their rack price references. “Regional average” is not an auditable index point. A named terminal with a published OPIS or Platts rack code is.

Which U.S. indexes should your procurement team track?
| Index / Source | What It Measures | Publication Cadence | Best Contract Use Case |
|---|---|---|---|
| NYMEX ULSD (CME Group) | National futures price for Ultra-Low Sulfur Diesel | Daily (exchange settlement) | National surcharge anchor; hedging reference |
| OPIS Rack / S&P Global Platts | Terminal-level spot and rack prices by location | Daily | Delivered contract commodity base; invoice verification |
| EIA/DOE Weekly Retail | National and PADD regional retail pump averages | Weekly (Mondays) | Fuel surcharge tables; macro trend monitoring |
| EIA PADD Regional Data | Supply, inventory, and price by PADD district | Weekly | Regional contract benchmarking; West Coast/Northeast exposure |
A few practical notes on when to use each:
- NYMEX ULSD works well as the commodity base in national or multi-site contracts where you want a single, exchange-verified reference. It is publicly available and hard to dispute.
- OPIS or Platts terminal-specific rack is the right choice when your deliveries originate from a known terminal. It ties the invoice directly to the price your supplier actually paid to load product.
- EIA PADD data is most useful for operations in the U.S. West Coast (PADD 5), Northeast (PADD 1), or other regions where supply constraints regularly push local prices above the national average. The EIA’s PADD-level analysis gives procurement teams the regional context to challenge a supplier’s pricing when it diverges from local terminal reports.
Why index literacy directly affects your fuel budget
Indexes drive your commodity cost and therefore every delivered-gallon line item and fuel surcharge on every invoice. That is not an abstraction. Oxford Economics lead U.S. economist Bernard Yaros has described diesel as “the workhorse fuel for the U.S. economy,” and energy analysts note that diesel prices often lag crude oil changes because refinery capacity limits slow the pass-through. That persistence means a geopolitical shock can keep your delivered price elevated for weeks after crude stabilizes.
Practical impacts for operations and procurement teams:
- Budgeting and cash-flow timing. Index-linked contracts with long lookback windows create a lag between market moves and invoice changes, which helps forecasting but can lock you into elevated rates during a price decline.
- Pass-through volatility. Diesel functions as a pass-through cost across construction, mining, data center operations, and logistics. When the index spikes, every delivered gallon carries that spike forward. Tracking diesel price fluctuations before contract renewal gives you leverage.
- Contract dispute resolution. A clearly defined index source is the only way to resolve billing disputes objectively. Vague language like “market price” gives suppliers unilateral pricing authority.
- Benchmarking supplier margins. If you know the terminal rack price on the delivery date, you can calculate exactly what spread your supplier is charging. Without that reference, you are negotiating blind.
How commercial contract pricing formulas are built
Most commercial delivered prices follow one of two structures: rack-plus (terminal rack price + margin + delivery fee + taxes) or index-linked (published index ± negotiated spread + delivery fee + taxes). Both are auditable when the contract defines the index source precisely.
A typical rack-plus formula looks like this:
Billed $/gal = Terminal Rack (OPIS) + Delivery Fee + Negotiated Margin + State/Federal Taxes
Example: $3.40 terminal rack + $0.18 delivery + $0.12 margin + $0.245 taxes = $3.945/gal billed
For index-linked contracts with a lookback, the commodity input is an average rather than a spot value. Lookback windows of 30–60 days are common in commercial programs; the lag provides invoice predictability but delays the benefit when prices fall.
| Contract Term | Typical Range | Purpose |
|---|---|---|
| Lookback / averaging window | 30–60 days | Smooths volatility; sets commodity input |
| Trigger / strike price | Varies by contract | Activates escalator surcharge above threshold |
| Escalator step | $0.05/gal per increment | Converts index delta to surcharge amount |
| Delivery fee | Negotiated | Covers logistics; should be a separate line item |
| Floor / ceiling | Negotiated | Caps maximum and minimum billed commodity cost |
Glossary of key terms:
- Rack: The price at which a distributor loads product at a terminal.
- Rack-plus: Terminal rack price plus margin and fees.
- Lookback window: The historical period used to calculate the average index input for an invoice.
- Averaging window: Synonymous with lookback; defines the date range for the index average.
- Trigger/strike price: The index level at which an escalator surcharge activates.
- Escalator: A step-based surcharge that increases the billed rate as the index rises above the trigger.
For a deeper look at agreement structures, the remote fueling service agreements guide covers how these clauses translate into on-site delivery contracts.
How to negotiate index-based pricing with a fuel supplier
Negotiation levers are index source, lookback/averaging period, spread/margin, delivery fees, invoicing frequency, and volume commitments. Address each one explicitly before signing.
Negotiation checklist:
- Establish the correct index point. Require a named terminal with a published OPIS or Platts rack code. Reject “regional average” or “national benchmark” without a specific source citation.
- Define the lookback window in writing. Specify the exact number of days and the start/end date logic. Ambiguity here is how suppliers quietly shift the averaging period to their advantage.
- Cap escalators. If the contract includes a trigger-price escalator, set a ceiling on the maximum surcharge per delivery period.
- Require monthly rack reports. Ask for the OPIS or Platts rack report for the cited terminal on each delivery date. This is the primary audit document.
- Set invoice dispute terms. Define a window (typically 30 days) within which you can dispute a line item, and specify what documentation the supplier must produce.
- Tie volume commitments to pricing tiers. Higher committed volumes should yield lower spreads. Get those tiers in writing with clear measurement periods. Bulk delivery programs typically offer better per-gallon economics at higher volume thresholds.
Red flags to watch for:
- Index defined only as “prevailing market price” with no named source
- Averaging window not specified or subject to unilateral supplier change
- Delivery fees bundled into the commodity line rather than shown separately
- Contract references DOE retail index for a wholesale delivered rate
- No audit rights or evidence requirements for invoice disputes
Pro Tip: Include an audit clause that gives you the right to request, within 30 days of any invoice, the OPIS or Platts rack report for the specific terminal cited, the load confirmation showing the delivery date and volume, and the state and federal tax calculation. A supplier unwilling to provide these three documents is a supplier worth replacing.
Worked example: from index quote to billed per-gallon price
The full calculation path from published index to billed invoice is straightforward once you know which inputs to pull.
Scenario A: Rack-plus delivered (daily rack reference)
- OPIS terminal rack price on delivery date: $3.40/gal
- Delivery fee: $0.18/gal
- Negotiated distributor margin: $0.12/gal
- Combined state and federal taxes: $0.245/gal
- Billed price: $3.945/gal
Scenario B: Index-averaged with 30-day lookback and escalator
- 30-day average OPIS rack (lookback period): $3.55/gal
- Trigger price in contract: $3.30/gal
- Index exceeds trigger by $0.25/gal; escalator step = $0.05/gal per $0.10 increment = $0.10 surcharge
- Delivery fee: $0.18/gal
- Negotiated margin: $0.12/gal
- Taxes: $0.245/gal
- Billed price: $4.195/gal
| Component | Scenario A (Daily Rack) | Scenario B (30-Day Lookback + Escalator) |
|---|---|---|
| Commodity base | $3.40 (day-of rack) | $3.55 (30-day average) |
| Escalator surcharge | — | $0.10 |
| Delivery fee | $0.18 | $0.18 |
| Margin | $0.12 | $0.12 |
| Taxes | $0.245 | $0.245 |
| Total billed $/gal | $3.945 | $4.195 |
On each invoice, verify: (1) the terminal name and OPIS rack code cited, (2) the delivery date used for the rack pull, (3) the delivery fee as a separate line, and (4) the tax calculation against your state’s published rate. A mismatch between the cited terminal and the terminal actually used for loading is one of the most common audit findings in commercial fuel contracts.
When national indexes don’t reflect your market
Regional supply imbalances can make national averages a poor proxy. Prefer terminal-specific or PADD-based indexes for any operation where local supply constraints are a real risk.
The U.S. West Coast (PADD 5) is the clearest example. The region has limited pipeline connectivity to the rest of the country, so refinery outages or import disruptions push local rack prices well above the national average. The same dynamic appears in the Northeast (PADD 1) during winter heating-oil demand peaks, when distillate supply tightens and diesel competes with heating oil for the same refinery output.
Key contract protections for regional exposure:
- Require PADD-specific indexing or a named terminal OPIS/Platts rack point for all deliveries, not a national average.
- Include an emergency pricing protocol that defines the index source and maximum allowable spread during declared supply emergencies or refinery outages.
- Add a force majeure pricing clause that caps the supplier’s margin (not the commodity cost) during regional disruptions.
- Monitor EIA PADD inventory data weekly during high-risk seasons. A sharp inventory draw in your PADD is an early signal to lock in volume before rack prices move.
Understanding the full supply chain from refinery to terminal helps operations teams anticipate where regional bottlenecks are most likely to appear.
Pro Tip: If your contract references a national index but your deliveries originate from a PADD 5 terminal, ask your supplier for an explicit regional adjustment formula. Without it, you are absorbing the full West Coast premium with no contractual protection.
Key Takeaways
Diesel pricing indexes are the wholesale reference points that set commodity cost in commercial contracts, and selecting the wrong index or leaving terms undefined is the fastest way to lose budget control on delivered fuel.
| Point | Details |
|---|---|
| Pick the right index | Use a named OPIS or Platts terminal rack point, not a national or regional average, for delivered contracts. |
| Define the lookback window | Specify the exact number of days in writing; an undefined averaging period gives suppliers unilateral pricing control. |
| Cap escalators and require transparency | Set a ceiling on escalator surcharges and require monthly rack reports as supporting documentation for every invoice. |
| Account for regional premiums | PADD 5 and PADD 1 operations face localized premiums; require PADD-specific or terminal-specific indexing in those markets. |
| Anytimefuelpros delivers index-anchored pricing | Anytimefuelpros provides terminal-sourced pricing, audit-ready invoices, and scheduled or emergency on-site delivery for commercial and industrial buyers. |
Anytimefuelpros delivers transparent, terminal-anchored fuel pricing
Commercial buyers who have spent time auditing invoices know the difference between a supplier who cites a vague “market rate” and one who hands you a terminal rack report with every delivery. Anytimefuelpros is built for the second category.

Anytimefuelpros prices deliveries against terminal-level rack data, provides audit-ready invoices that show the commodity base, delivery fee, and taxes as separate line items, and offers scheduled bulk delivery programs for construction sites, data centers, mining operations, and events across Texas, Utah, and the continental United States through its national partner network. Whether you need a recurring delivery schedule tied to a defined index or emergency on-site diesel when a generator goes critical at 2 AM, the operation is built to respond.
For operations teams evaluating a new fuel contract or reviewing an existing one, the benefits of on-site fuel delivery page outlines exactly what transparent, index-anchored service looks like in practice. Ready to set up a delivery program or get a contract quote? Order now or contact Anytimefuelpros directly to discuss custom procurement terms.
Useful sources and data feeds to bookmark
The authoritative sources for diesel index monitoring are OPIS/Platts for terminal rack, NYMEX ULSD for futures, and EIA/DOE for weekly retail and PADD regional data. Publication cadences vary, so knowing when each updates helps you time contract reviews and invoice audits.
- NYMEX ULSD (CME Group) — Daily exchange settlement; the national futures anchor for Ultra-Low Sulfur Diesel contracts.
- OPIS Diesel Products (S&P Global) — Daily rack and spot pricing by terminal and region; the primary invoice verification tool for wholesale buyers.
- EIA Weekly Diesel Prices — Published each Monday; national and PADD regional retail averages, plus supply and inventory data useful for regional trend analysis.
- DOE Diesel Index (weekly retail) — Weekly retail survey used in fuel surcharge tables; not a wholesale proxy, but useful for understanding the retail-to-rack gap.
- Anytimefuelpros Fuel Knowledge Hub — Practical guides on diesel pricing, delivery logistics, and contract structures for commercial and industrial buyers.
For commodity hedging context, understanding why traders use commodity instruments can help procurement teams evaluate whether a fixed-price window or an indexed exposure better fits their risk profile.
Recent Comments